This devblog entry describes how to activate the DevTools window with advanced options to debug webpages in a SiteKiosk Online browser
We start with the template browser and add an start URL to the webpage element.
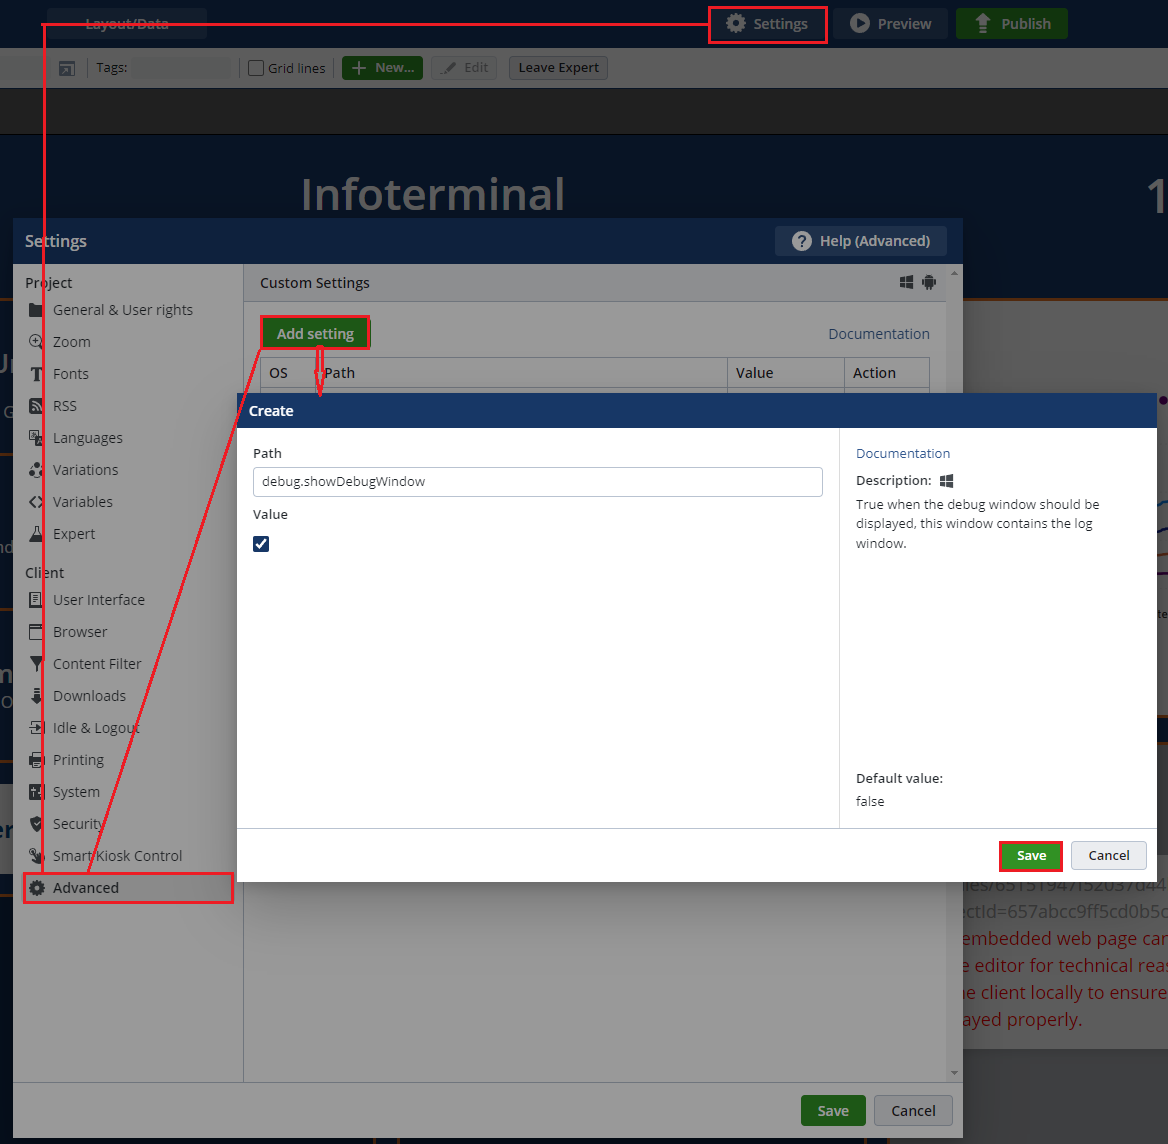
Now we need to add two entries in the advanced settings of the project.
Go to >Settings > Client > Advanced and press the Add setting button.
Enter debug.showDebugWindow under Path and enable the checkbox under Value.
Press the save button
Press the Add setting button again.
Enter debug.showAdvancedOptionsInDebugWindow under Path and enable the checkbox under Value.
Press the save button
Finally, press the Save button to save the advanced settings.
Publish the project on the client.
Select the DevTools tab in the debug window.
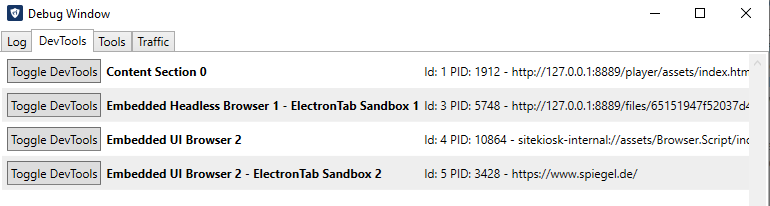
Click on the Embedded UI Browser button to open the Devtools window.
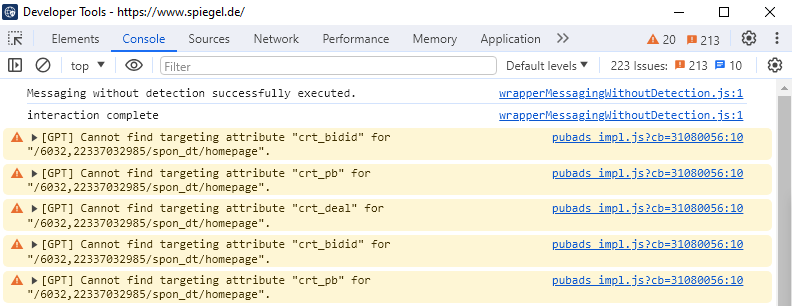
In the Developer Tools select the tab Console to analyze possible Errors in the web page.
af15cbe9-87f1-4e67-97be-ba59464407fe|1|5.0
When you are using the SiteKiosk Windows Chrome Browser you can activate the Chrome DevTools to debug web pages in SiteKiosk.
To activate this option, you need to create an empty text file with the file name debug.txt. This file must be placed in the folder ..\SiteKiosk\Chromium\.
When you start SiteKiosk with the Chrome Browser engine after that change, you can click on the browser pane of SiteKiosk and hit the F11 button to open up the Chrome DevTools window.

Remember to delete or rename the debug.txt file after you are done with debugging.
9a24a57d-3835-4ec9-8732-61833bce1c1c|3|4.7
SiteKiosk Android allows you to debug webpages that are running in the SiteKiosk Android browser.
To activate this option you have to go into the settings of SiteKiosk Android, then you have to switch into the extended configuration mode. The extended configuration mode will show some options that are otherwise hidden. These are either experimental options or options useful to developers.
To enable the extended configuration mode, you need to tab seven times into the upper left corner of the configuration, right on the SiteKiosk Android logo. Please note the waring dialog, that tells you about the experimental status of the settings that are now unhidden.
In the extended configuration mode, you should go to the System page and tick the option Enable web debugging.
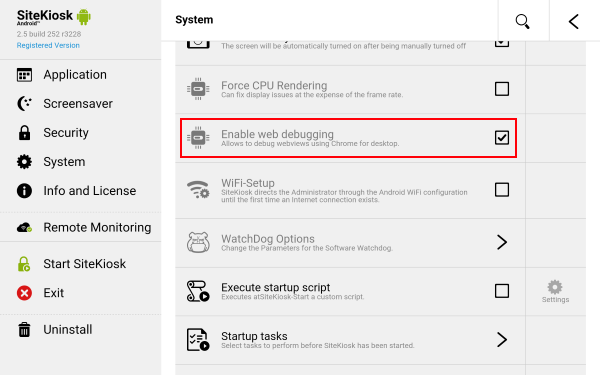
This is the only thing specific to SiteKiosk you need to do. The rest of the debugging process is described in detail on the Google Developers pages.
After you are done with the debugging please do not forget to disable the web debugging option of SiteKiosk again.
310696ec-f5cb-4d7f-a9d2-e3c9755c642a|0|.0